
Automated Pharmacy Reporting: End Manual Data Compilation
Discover how automated reporting transforms pharmacy management. Learn to generate compliance, performance, and operational reports without manual data compilation.
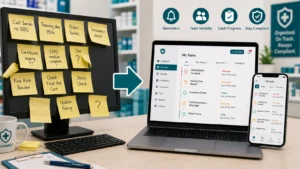
It is the last day of the month. Report deadline: end of day. You are sitting at your desk surrounded by till printouts, paper logs, three different spreadsheets, handwritten notes, last month report for reference, and a calculator.
For the next several hours, you will manually extract numbers, check calculations, compile data, and create the monthly report. The same exercise you completed last month. And will complete next month.
This is 2026. There has to be a better way.
The Problem with Manual Reporting
Time Consumption
Monthly reporting cycles typically consume 2 to 4 hours for basic compliance reports, 4 to 8 hours for comprehensive operational reports, additional time for error checking and correction, and further time when recipients request clarification.
Multiply by twelve months, and reporting alone consumes days of management time annually.
Error Risk
Manual data handling introduces errors including transcription mistakes, calculation errors, formula problems in spreadsheets, outdated data sources, and missing data periods.
Errors damage report credibility and may lead to poor decisions.
Timeliness Issues
Manual reports are always backward-looking. Data is compiled after the period ends. Several days pass to produce the report. Insights are available too late for action. Historical focus replaces predictive analysis.
Consistency Challenges
Different people produce different reports with format variations, methodology differences, definition inconsistencies, and comparability problems.
What Should Be Reported
Compliance Reports
Essential compliance metrics include staff registration status, training completion rates, certificate currency, DBS check status, insurance validity, and overall compliance percentage.
Operational Reports
Key operational metrics include services delivered by type, appointment volumes and utilisation, no-show rates, patient volumes, prescription volumes, and consultation completion rates.
Financial Reports
Financial performance metrics include service revenue by category, average transaction values, period comparisons, and budget versus actual performance.
Quality Reports
Quality and safety metrics include incident rates, near misses, patient feedback scores, complaint volumes and resolution, and audit results.
Principles of Effective Reporting
Report What Matters
Not everything measurable matters. Not everything that matters is easily measured. Focus on metrics linked to regulatory requirements, indicators of service quality, measures that drive action when they change, and data that supports business decisions.
Avoid vanity metrics that look good but do not inform action.
Make Reports Actionable
Good reports lead to action through clear presentation of status versus target, highlighted exceptions requiring attention, trend analysis showing direction, and drill-down capability for investigation.
Ensure Accuracy
Reports must be trustworthy with data sourced from authoritative systems, calculation methodology documented, verification processes in place, and known limitations acknowledged.
Enable Comparison
Reports gain value through comparison including period-over-period trends, target versus actual performance, site versus site benchmarking, and service versus service analysis.
Moving to Automated Reporting
Data Foundation
Automated reporting requires data in digital systems including compliance data in management platform, service data in booking and delivery systems, financial data in accounting systems, and quality data in incident management systems.
You cannot automate reports from paper records.
Report Design
Define what you need including which metrics, what time periods, what comparisons, what format, and who receives. Design reports for your specific needs, not generic templates.
Automation Configuration
Configure report generation including data sources and queries, calculation rules, presentation format, generation schedule, and distribution list.
Validation Process
Even automated reports need validation through reasonableness checks, comparison with expectations, investigation of anomalies, and periodic methodology review.
Benefits of Automated Reporting
Time Savings
Automated reports generate in seconds, not hours. No manual data extraction. No manual calculation. No manual formatting. No manual distribution.
Management time redirects to analysis and action.
Consistency
Every report follows the same methodology with same data sources, same calculations, same format, and same timing. Comparability is assured.
Accuracy
Automated systems do not make transcription errors. Data is pulled directly from source. Calculations are performed correctly every time. No manual entry mistakes occur. Audit trail of report generation is maintained.
Timeliness
Reports are available when needed with real-time dashboards for current status, scheduled reports generated automatically, on-demand reports when required, and no waiting for manual compilation.
Frequency
When reports do not require manual effort, frequency can increase. Monthly becomes weekly. Weekly becomes daily. Daily becomes real-time dashboards.
More frequent insight enables faster response.
Implementing Automated Reporting
Step 1: Audit Current Reports
Understand your current state. What reports do you produce? How long does each take? Where does data come from? Who uses each report? What decisions do they inform?
Step 2: Rationalise Requirements
Challenge necessity. Which reports are actually used? Which could be combined? Which could be eliminated? What is missing that is needed?
Step 3: Ensure Data Availability
Verify data foundations. Is all required data in digital systems? Is data accurate and complete? Can data be extracted and queried? Are systems integrated or siloed?
Step 4: Select Reporting Tools
Choose appropriate technology including built-in platform reporting, business intelligence tools, custom report development, or spreadsheet automation. Match tools to requirements and capabilities.
Step 5: Build and Test
Develop automated reports by configuring data connections, building report templates, testing against manual reports, validating accuracy, and refining presentation.
Step 6: Deploy and Monitor
Roll out automated reporting by communicating changes to recipients, retiring manual processes, monitoring report usage, gathering feedback, and continuously improving.
Free Your Time from Reporting
Manual reporting is a remnant of pre-digital pharmacy management. Modern systems can generate accurate, timely, consistent reports automatically, freeing your time for analysis, action, and patient care.
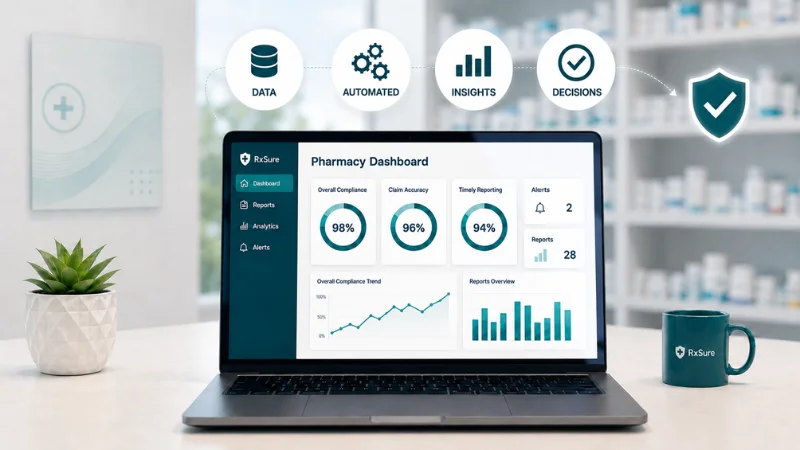
RxSure provides comprehensive automated reporting for pharmacy compliance. Dashboard views, scheduled reports, and one-click evidence generation replace hours of manual compilation.
Start your free trial and automate your reporting today.